Table of Contents
The Staff Selection Commission (SSC) conducts the Combined Graduate Level (CGL) Examination each year to recruit candidates for Group B and C posts in various ministries and departments of the Government of India. By examining data from past years—such as the number of vacancies, applicants, and those who appeared for the exam—aspirants can gain insights into the level of competition and difficulty of the exam. This analysis will also help them better understand the selection process and plan for future attempts.
Number of Applicants for SSC CGL 2024
While the official number of applicants for SSC CGL 2024 has not yet been released by the SSC, a recent RTI response has revealed that 34,83,411 candidates have registered for the exam.

SSC GCL 2024 Tier 1 Attendance
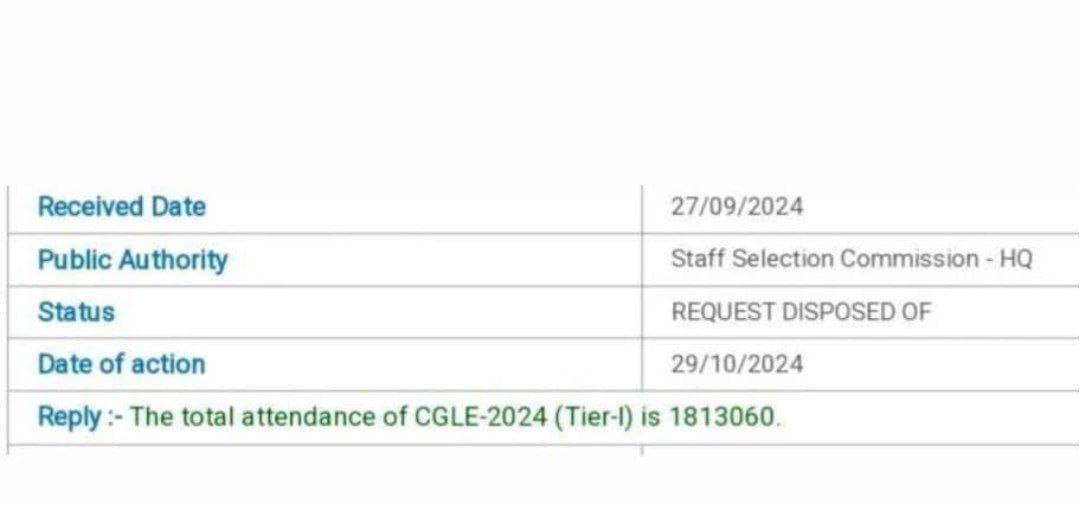
As per the latest response to an RTI, the Staff Selection Commission has disclosed the number of candidates who appeared for the SSC CGL 2024 Tier-I examination. Previously, we shared the total registered candidates, and now we’re providing the detailed attendance data for Tier-I. This year, out of 34,83,411 registered candidates for the SSC CGL 2024 exam, 18,13,060 appeared for the Tier-I exam, resulting in an attendance rate of about 52%. This is the highest attendance recorded so far in SSC CGL history when compared to previous years.

How many Applications were received for SSC CGL 2023?
Wondering how many applications were received for SSC CGL 2023? The number of applications received for any recruitment drive is disclosed by the recruitment authority after the completion of the application procedure. According to the data released by the Staff Selection Commission, the total number of applications received for SSC CGL 2023 is 24,74,030.
According to an RTI reply, the attendance for the SSC CGL 2023 Tier 1 exam was 49.97%. This means that 12,36,202 candidates were present for the exam, while 12,37,828 candidates were absent. The total number of candidates scheduled to appear for the exam was 24,74,030.
There are several benefits of knowing the number of applications received for SSC CGL 2023. The benefits are as follows:
- Competition Assessment: Knowing the number of applications received for SSC CGL 2023 enables applicants to assess the level of competition associated with the exam which in turn helps applicants to plan and strategize their preparations accordingly.
- The popularity of Examination: The number of applications also helps an individual to know the popularity of SSC CGL 2023. The higher the number of applications, the more popular the exam is likely to be, and vice versa.
Candidates can check category wise number of applications received for SSC CGL 2023 in the below-given table:-
| Category | No. of Applications Received |
| UR | 5,83,421 |
| OBC | 9,47,864 |
| EWS | 1,88,902 |
| SC | 5,34,968 |
| ST | 2,18,875 |
| Total | 24,74,030 |
Staff Selection Commission Combined Graduate Level Examination is conducted to recruit staff to various posts in ministries, and departments, SSC is the second preferred exam after UPSC throughout India as it recruits the highest number of employees/officers. Thousands of young graduates apply for the SSC CGL exams with the hope of getting a government job with a lucrative salary and organizations of the Government of India. SSC is a secured job with a good salary and perks. It gives a chance to become a part of the government organization with pensions and similar benefits for the candidates.

Candidates must know how many candidates appeared in SSC CGL over the years. Based on the aggregate performance of Tier-1 and Tier-2, the candidates will be shortlisted for the final stage of document verification.
| EXAM YEAR | 2024 | 2023 | 2022 | 2021 | 2020 | 2019 | 2018 | 2017 |
|---|---|---|---|---|---|---|---|---|
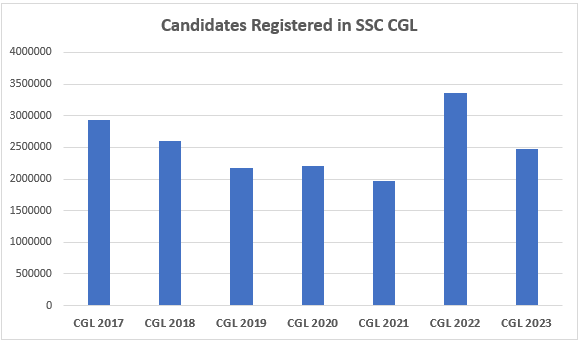
| No. Of Registered Candidates | 34,83,411 | 24,74,030 | 33,55,194 | 19,63,324 | 22,09,867 | 21,77,843 | 25,97,431 | 29,28,826 |
| No. of Appeared Candidates | 18,13,060 | 12,36,202 | 16,16,687 | 7,80,380 | 7,16,408 | 9,79,215 | 8,36,501 | 15,43,962 |
| Overall % of Attendance | 52% | 49.97% | (48.18%) | 39.74% | 32.41% | 44.96% | 32.20% | 52.71% |
| No. of Candidates Qualified in Tier 1 | – | 81,752 | 3,60,112 | 2,92,445 | 1,14,070 | 1,25,279 | 1,50,419 | 1,89,838 |
| %age of Candidates Qualified | – | 6.61% | 22.27% | 37.47% | 15.92% | 12.79% | 17.98% | 12.29% |
| No. of Vacancies | 17,727 | 8,415 | 36,012 | 7,621 | 7,108 | 8,428 | 11,105 | 8,121 |
| Tier 1 Cut off for UR (Except AAO & JSO Posts) |
– | 150.04936 | 114.27651 | 130.18384 | 132.37260 | 147.78606 | 137.07 | 131.00 |
| Tier 1 +Tier II Cut Off (Except AAO & JSO Posts) |
– | Not Applicable | Not Applicable | 478.55241 | 433.61707 | 528.38462 | 433.00 | 415.50 |
| Final Cut Off | Varies Post-Wise | |||||||


 Free Study Material for SSC CGL 2025, Do...
 SSC CGL 2025: Will the Number of Vacanci...
 SSC CGL 2025: Why It Will Be the Most Co...


