Venn Diagrams
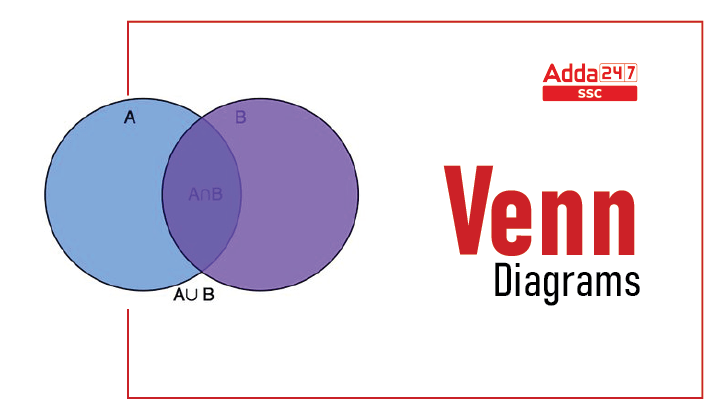
Venn diagrams are visual tools that use circles or other shapes to represent the relationship between different elements or concepts. Imagine you have two circles that overlap with each other. The overlapping part represents the common aspects between the two elements. On the other hand, the parts of the circles that do not overlap represent the differences between the two elements. Venn diagrams are also called Set diagrams or Logic diagrams. They are widely used in various fields like mathematics, statistics, logic, teaching, linguistics, computer science, and business to present information in a visual and easy-to-understand format.
Venn Diagrams Reasoning
Venn diagram is an important topic in the general intelligence or reasoning section which is asked in almost all the exams. The Venn diagram in reasoning is used to represent the data or concept through diagrams or pictures. In this article, we will discuss Venn diagram examples and some related questions in detail. Venn diagrams help you to clearly see the similarities and differences between two or more concepts, making it easier to understand the relationships between them.
Types of Venn Diagrams
Generally, Venn diagrams are of three types namely two-element Venn diagram, three-element Venn diagram, and four elements Venn diagram depending on the given condition. You can understand all the types through the Venn diagrams questions given in the article.
Venn Diagrams Symbols
Venn diagrams symbols are used to represent the relationship between given elements. The Venn diagrams symbols with examples are discussed below.
- Union (∪): It represents the union of all the sets – i.e., the universe of all elements within X and Y sets. The union of the set is given here.
- Intersection (∩): Intersection represents all elements shared or common within the selected sets or groups. It represents the shared or common elements (in the middle) within the sets X and Y.
- Complement (XC): Complement represents whatever is not represented in a particular set; in this case, everything not in set X. An equation to illustrate the complement of X is XC = U/A, where U illustrates a given universe of elements. The diagram below shows the absolute complement of X in U.
Venn Diagrams Formulas
Venn diagrams formulas are used to solve the problems based on Venn diagrams easily. The Venn diagrams formulas for 2 and 3 sets are discussed here.
- n ( A ∪ B) = n(A ) + n ( B ) – n ( A∩ B)
- n (A ∪ B ∪ C) = n(A ) + n ( B ) + n (C) – n ( A ∩ B) – n ( B ∩ C) – n ( C ∩ A) + n (A ∩ B ∩ C)
- And so on, where n(A) = number of elements in set A.
Venn Diagrams for Sets
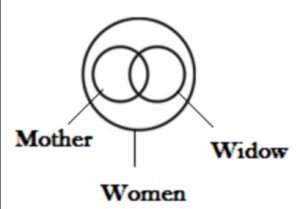
A set is a collection of things or elements shown by the pictures. Venn diagrams for sets are given here with examples. Refer to these questions to understand the topic in detail.
Venn Diagrams Questions
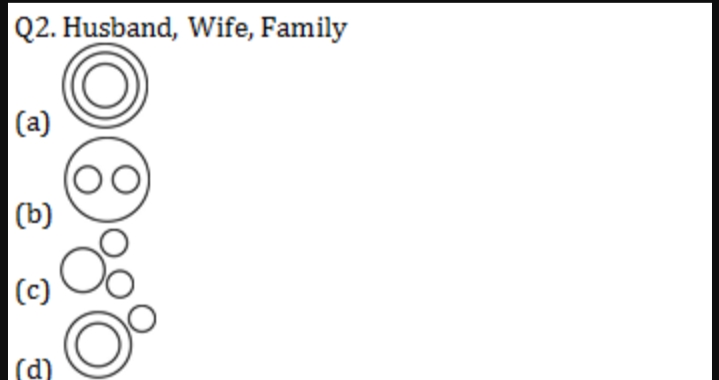
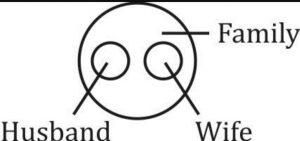
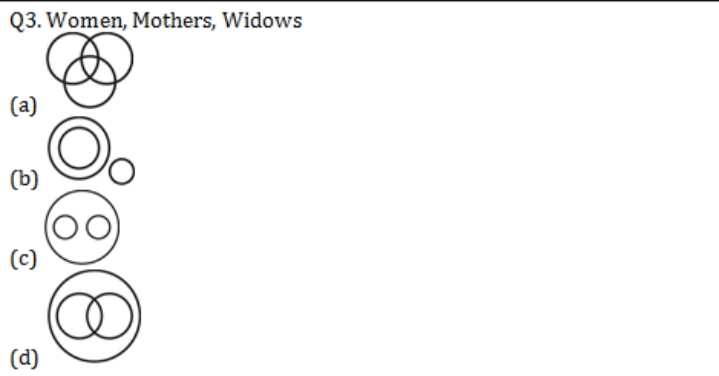
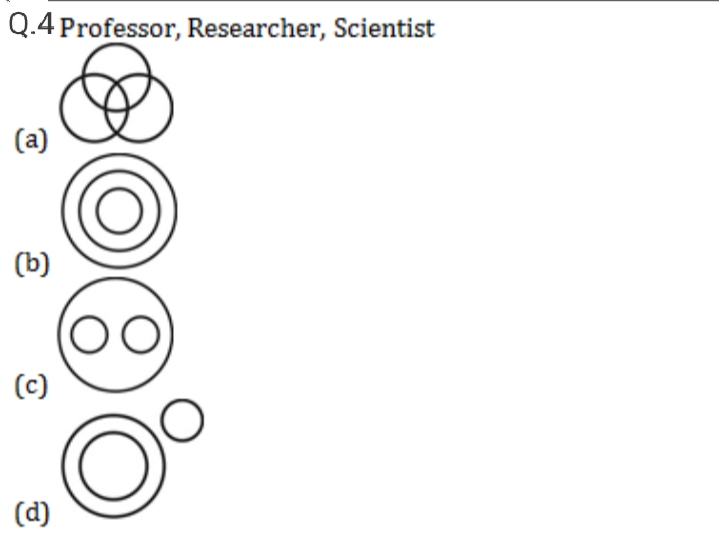
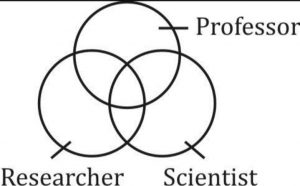
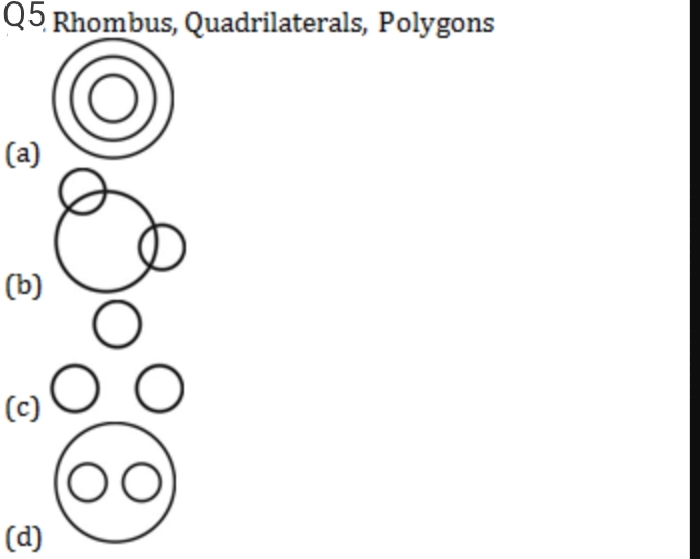
Venn diagrams questions require practice and logical ability to solve them easily. We are going to discuss here some important Venn diagram questions for a better understanding of concepts. So practice these questions for your upcoming exams.
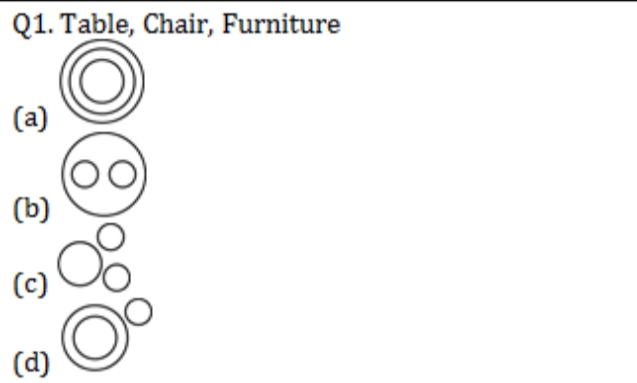
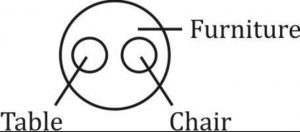
Solution: Ans (b) The pictorial representation of the Table, Chair, and Furniture is shown here
